Data Sources
Provides an interface for accessing generic data.
# Creating Data Sources
Every plugin can register any number of data sources. It is recommended to create a new data source for each type of data provided by a plugin. For example, if a plugin offers both customer and sales data, having two separate data sources would simplify widget configuration for end users.
Data sources are classes that extend the Dashboard\Classes\ReportDataSourceBase class. Each data source must register at least one metric and one dimension. In addition, data source classes must implement the fetchData method, which is required to return the ReportFetchDataResult object. In most cases, when your data source fetches data from the database, you can use the ReportQueryBuilder class, which provides a fluent interface for constructing and executing database queries based on the dimension and metrics configuration.
use Db;
use Carbon\Carbon;
use Dashboard\Classes\ReportMetric;
use Dashboard\Classes\ReportDimension;
use Dashboard\Classes\ReportDimensionField;
use Dashboard\Classes\ReportDataSourceBase;
use Dashboard\Classes\ReportFetchData;
use Dashboard\Classes\ReportFetchDataResult;
use Dashboard\Classes\ReportQueryBuilder;

class MyReportDataSource extends ReportDataSourceBase
{
    public function __construct()
    {
        // Register dimensions and metrics here
    }

    protected function fetchData(ReportFetchData $data): ReportFetchDataResult
    {
        // Construct and return a ReportFetchDataResult object,
        // or use the ReportQueryBuilder class to do the hard work.
    }
}
The ReportFetchData object has the following properties available.
| Property | Type | Description |
|---|---|---|
| $dimension | ReportDimension | the dimension to group the data by |
| $dimensionCode | string | the dimension code string |
| $metrics | array | the metrics to return (array of ReportMetric objects) |
| $metricCodes | array | the metric code strings |
| $metricsConfiguration | array | the report metrics configuration (array of ReportMetricConfiguration objects) |
| $dateStart | ?Carbon | the start date |
| $dateEnd | ?Carbon | the end date |
| $compareDateStart | ?Carbon | the comparison period start date (for period-over-period comparisons) |
| $compareDateEnd | ?Carbon | the comparison period end date |
| $startTimestamp | ?int | optional starting timestamp for relative intervals (e.g., past hour) |
| $dimensionFilters | array | the filters to apply to the dimension values (array of ReportDimensionFilter objects) |
| $groupInterval | ?string | the group interval (one of the GROUP_INTERVAL_* constants: DAY, WEEK, MONTH, QUARTER, YEAR, FULL) |
| $orderRule | ?ReportDataOrderRule | the data ordering rule |
| $limit | ?int | the maximum number of records to return |
| $paginationParams | ?ReportDataPaginationParams | the pagination parameters |
| $hideEmptyDimensionValues | bool | indicates whether empty dimension values must be removed from the dataset |
| $totalsOnly | bool | indicates that the method should only return total values for metrics, and not rows |
| $resetCache | bool | indicates that the cache should be reset |
Plugins must register their data sources in the Plugin Registration file (Plugin.php), within the boot method.
use Dashboard\Classes\DashManager;

public function boot()
{
    DashManager::instance()->registerDataSourceClass(
        MyReportDataSource::class,
        'My Custom Data Source' // This can be a reference to a localization string
    );
}
We will use a simple ecommerce plugin database structure for the documentation examples. The plugin includes the following tables.
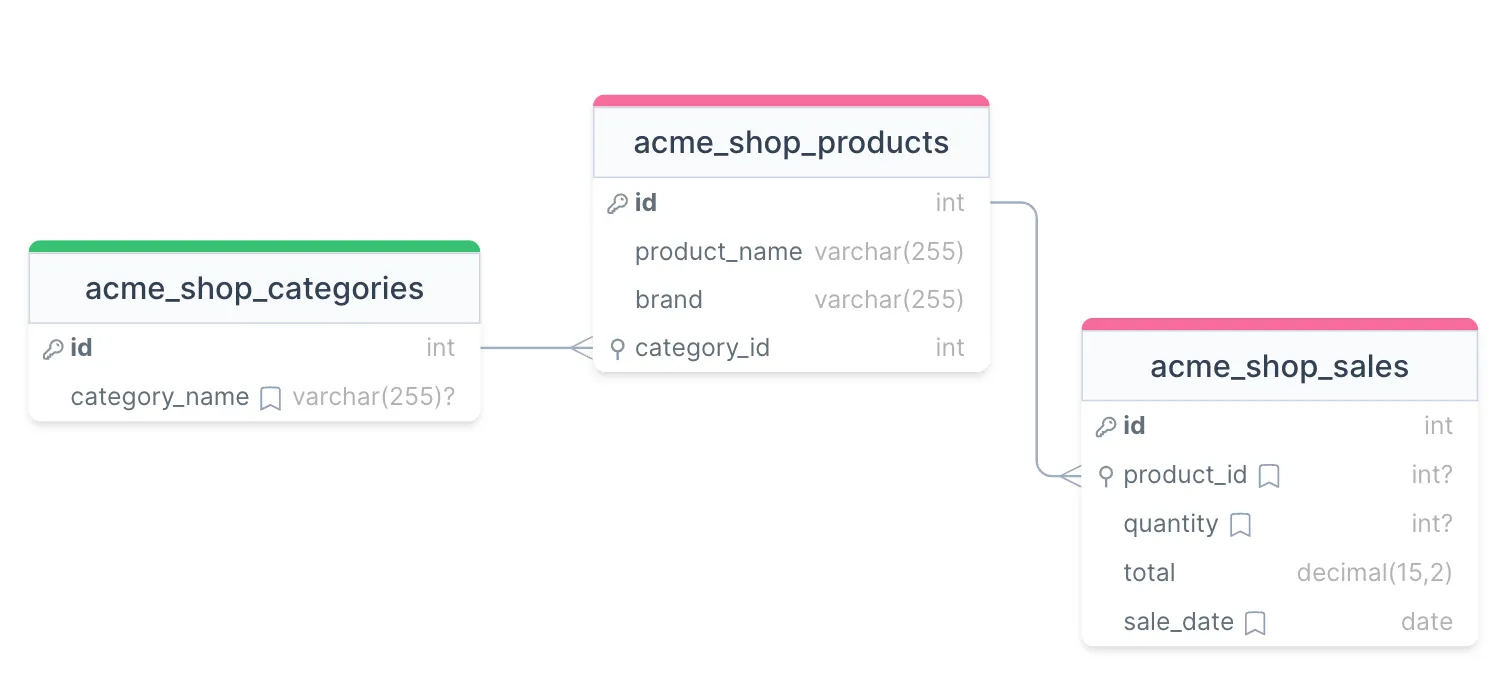
We'll create a data source to display sales data for products and categories in the form of a table, graph, and indicator.
# Registering Dimensions
Data sources must register their metrics and dimensions in the constructor. Use the registerDimension method to register a dimension. Let's begin by registering the product dimension for our e-commerce plugin example.
const DIMENSION_PRODUCT = 'product';

public function __construct()
{
    $this->registerDimension(new ReportDimension(
        self::DIMENSION_PRODUCT,
        'acme_shop_products.id',
        'Product',
        'product_name'
    ));
}
The registerDimension method accepts a ReportDimension object. The constructor for ReportDimension takes the following arguments.
| Argument | Type | Description |
|---|---|---|
| $code | string | specifies the dimension referral code. Your data source will use this code to distinguish the dimension in the fetchData calls. It can be a simple string, for example, “city”. |
| $databaseColumnName | string | specifies the dimension column name in the data source table. The column name is used in ReportDataQueryBuilder to construct database queries. Including the table name (acme_shop_products in this case) along with the column name is often necessary to avoid ambiguity when the data source query includes multiple tables. If your data source is not database-driven, any value can be used for this argument. In most instances, the dimension column corresponds to the primary key in the dimension table. |
| $displayName | string | specifies the dimension name used in reports. For example, in the Table widget, this could become the title of the dimension column. It is also used in the widget configuration popup, in the dimension dropdown. The value for this argument can be a static string, or a reference to a localization string. |
| $labelColumnName | ?string | specifies the name of the column for the dimension label. Use this column to provide a user-friendly label for the dimension. If this argument is not provided, the value of $databaseColumnName is used as the dimension label. Keep in mind that widget dimension sorting and filters will utilize the dimension label value when the label column name provided. |
The registerDimension method returns the registered dimension object, allowing for chaining.
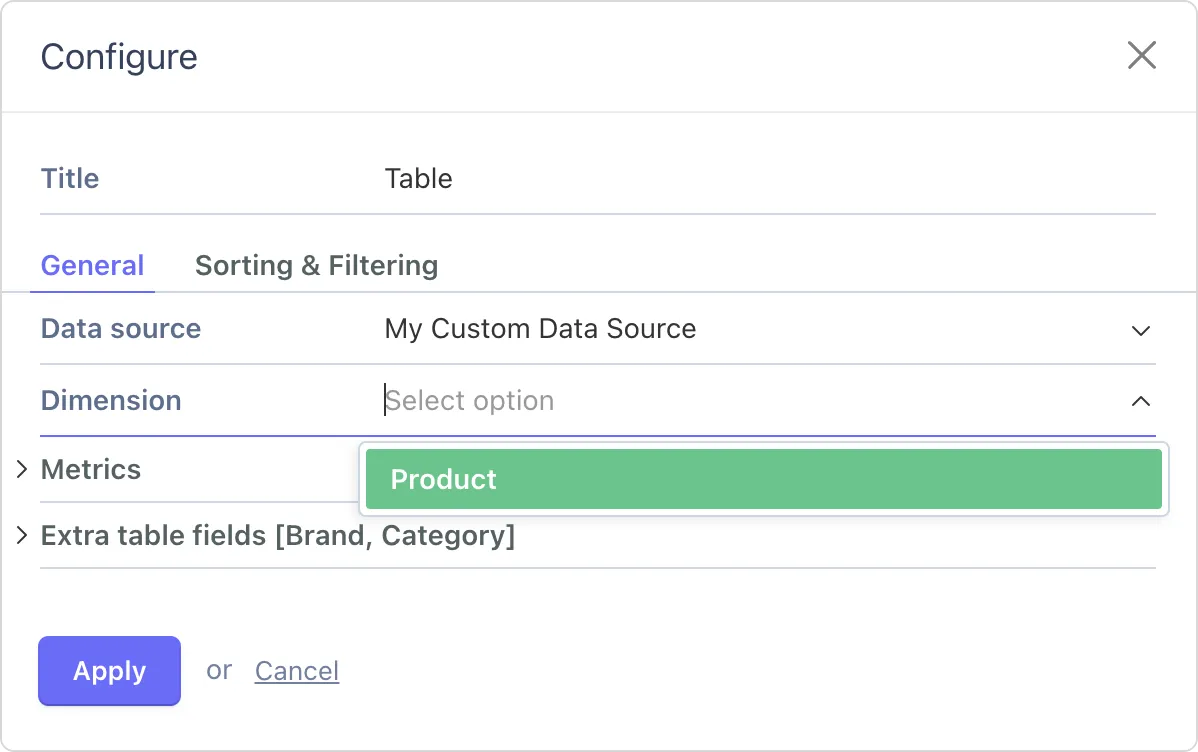
After registering the data source and dimension, you should be able to view them in the dashboard widget configurator.
# Registering Metrics
We can register two metrics associated with products: sale amount and quantity. These metrics are registered using the registerMetric method of the data source class.
const METRIC_TOTAL_AMOUNT = 'total_amount';
const METRIC_TOTAL_QUANTITY = 'total_quantity';

public function __construct()
{
    ...

    $this->registerMetric(new ReportMetric(
        self::METRIC_TOTAL_AMOUNT,
        'acme_shop_sales.total',
        'Total amount',
        ReportMetric::AGGREGATE_SUM
    ));

    $this->registerMetric(new ReportMetric(
        self::METRIC_TOTAL_QUANTITY,
        'acme_shop_sales.quantity',
        'Quantity',
        ReportMetric::AGGREGATE_SUM
    ));
}
The registerMetric method accepts a ReportMetric object. The constructor for this class has the following arguments:
| Argument | Type | Description |
|---|---|---|
| $code | string | the metric referral code. |
| $databaseColumnName | string | the metric column name. It's always a good idea to provide the table name along with the field name to avoid ambiguity in SQL queries. |
| $displayName | string | the metric name used in reports. |
| $aggregateFunction | string | the aggregate function for the metric. One of the ReportMetric::AGGREGATE_XXX constants. |
| $intlFormatOptions | ?array | client-side formatting options, compatible with the Intl.NumberFormat() constructor options argument. Skip the argument to use the default formatting options. |
The dashboard can aggregate metric data using one of the following functions:
ReportMetric::AGGREGATE_SUM
ReportMetric::AGGREGATE_AVG
ReportMetric::AGGREGATE_MIN
ReportMetric::AGGREGATE_MAX
ReportMetric::AGGREGATE_COUNT
ReportMetric::AGGREGATE_NONE
ReportMetric::AGGREGATE_COUNT_DISTINCT
ReportMetric::AGGREGATE_COUNT_DISTINCT_NOT_NULL
For our needs, the SUM function is the most suitable as our metrics are the total quantity and amount. Therefore, we use ReportMetric::AGGREGATE_SUM in the constructors of both metrics.
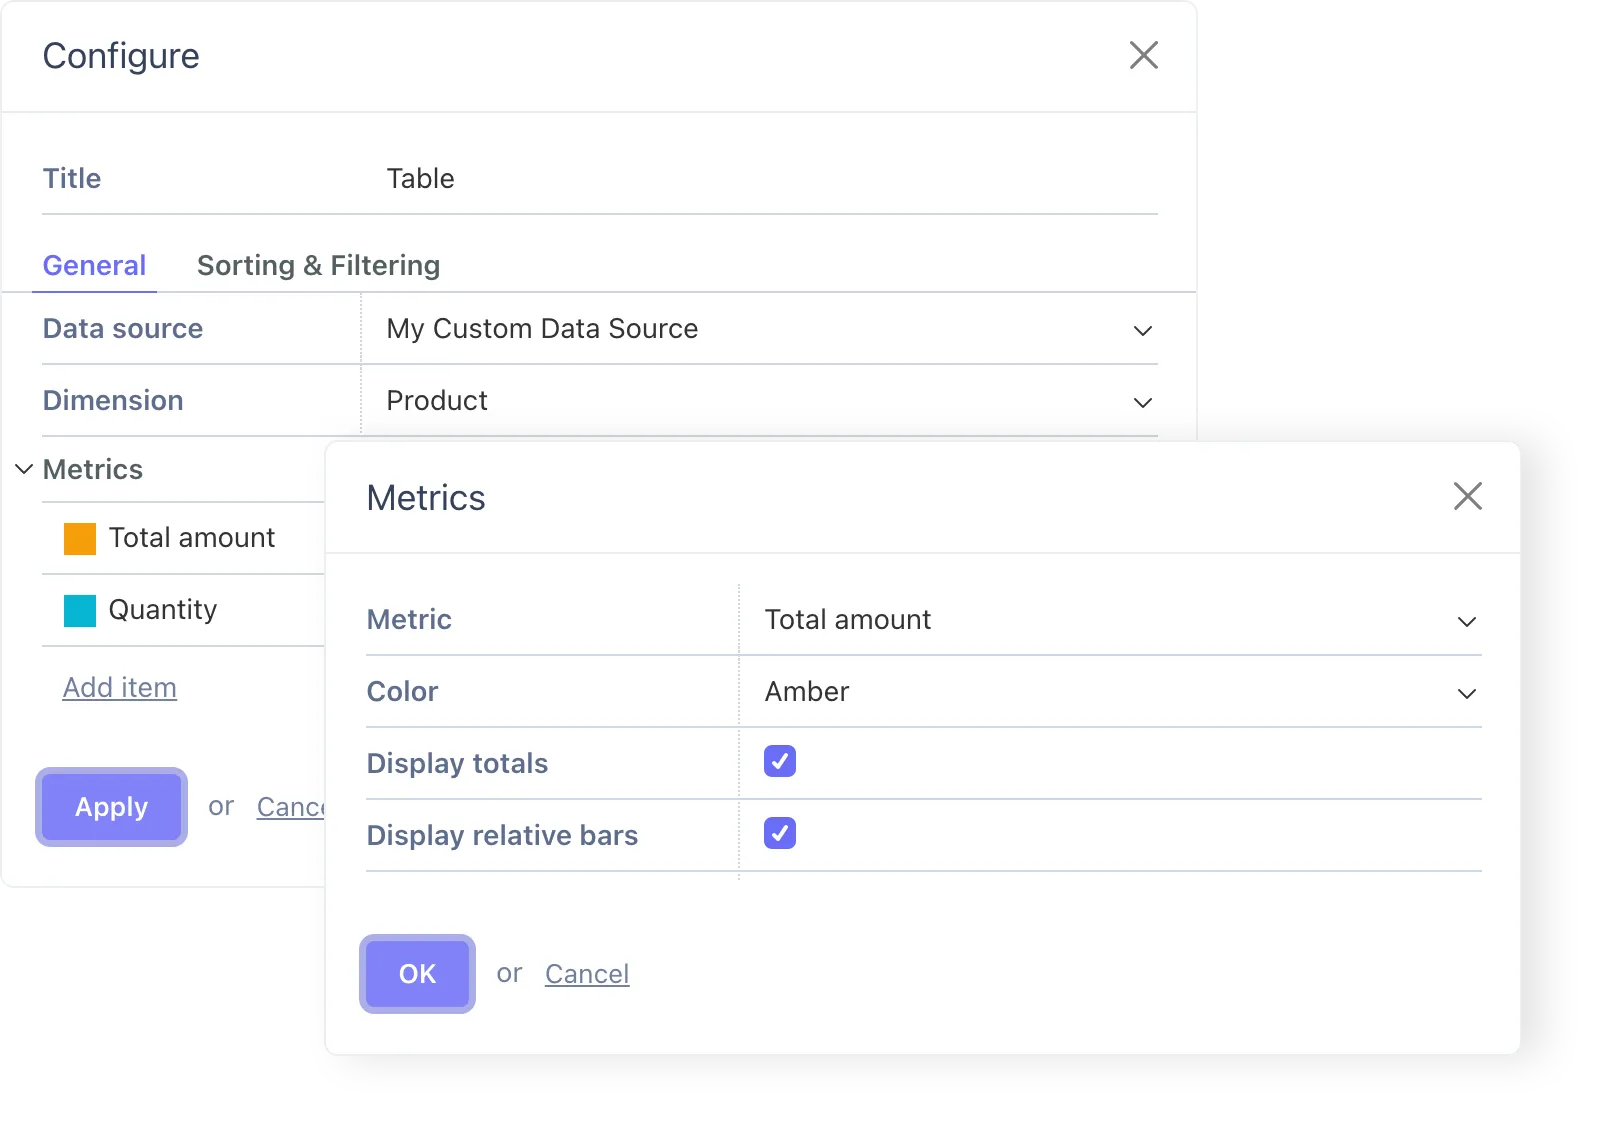
After registering the metrics, you can add them to a dashboard widget configuration:
# Returning Data from a Data Source
Data sources should implement the fetchData method to return data for the requested dimension, metrics, and dimension fields. The ReportQueryBuilder class provides a fluent interface that makes this straightforward.
The use of ReportQueryBuilder is optional. The sole requirement for the fetchData method is to return a Dashboard\Classes\ReportFetchDataResult object. If your data source doesn't work with a database, or if you need more control, you can use native Laravel classes to load the data.
# Using ReportQueryBuilder (Recommended)
The simplest way to implement fetchData is using the fromFetchData static method, which automatically configures the builder from the request data:
protected function fetchData(ReportFetchData $data): ReportFetchDataResult
{
    if ($data->dimension->getCode() !== self::DIMENSION_PRODUCT) {
        throw new SystemException('Invalid dimension');
    }

    return ReportQueryBuilder::fromFetchData($data, 'acme_shop_products')
        ->dateColumn('acme_shop_sales.sale_date')
        ->onConfigureMetrics(function($query, $dimension, $metrics) {
            $query->leftJoin('acme_shop_sales', function($join) {
                $join->on('acme_shop_sales.product_id', '=', 'acme_shop_products.id');
            });
        })
        ->get($data->metricsConfiguration);
}
The fromFetchData method accepts the ReportFetchData object and the main table name. It automatically configures:
- The dimension and metrics from the request
- Ordering, filtering, pagination, and limits
- Date range and group interval settings
- The
totalsOnlyandhideEmptyValuesflags
You then chain additional configuration:
dateColumn()- specifies the column used to filter by the user's selected date rangetimestampColumn()- optional column for relative time filtering (e.g., "past hour")onConfigureMetrics()- callback to join tables or configure metric columnsonConfigureQuery()- callback for additional query customization
# Building Queries Manually
For more control, you can build the query step by step using the fluent interface:
protected function fetchData(ReportFetchData $data): ReportFetchDataResult
{
    return ReportQueryBuilder::table('acme_shop_products')
        ->dimension($data->dimension)
        ->metrics($data->metrics)
        ->orderBy($data->orderRule)
        ->filters($data->dimensionFilters)
        ->limit($data->limit)
        ->groupInterval($data->groupInterval)
        ->hideEmptyValues($data->hideEmptyDimensionValues)
        ->dateRange($data->dateStart, $data->dateEnd, 'acme_shop_sales.sale_date')
        ->totalsOnly($data->totalsOnly)
        ->onConfigureMetrics(function($query, $dimension, $metrics) {
            $query->leftJoin('acme_shop_sales', function($join) {
                $join->on('acme_shop_sales.product_id', '=', 'acme_shop_products.id');
            });
        })
        ->get($data->metricsConfiguration);
}
# Semantic Group Interval Methods
For date-based dimensions, you can use semantic methods instead of passing interval constants:
ReportQueryBuilder::fromFetchData($data, 'orders')
    ->dateColumn('order_date')
    ->groupByYear()    // or groupByMonth(), groupByWeek(), groupByDay(), groupByQuarter()
    ->get($data->metricsConfiguration);
# Conditional Configuration
Use the when() method to conditionally apply configuration:
ReportQueryBuilder::fromFetchData($data, 'orders')
    ->dateColumn('order_date')
    ->when($data->limit, fn($builder) => $builder->limit($data->limit))
    ->when($onlyCompleted, fn($builder) => $builder->onConfigureQuery(
        fn($query) => $query->where('status', 'completed')
    ))
    ->get($data->metricsConfiguration);
# Available ReportQueryBuilder Methods
| Method | Description |
|---|---|
table($name) | Static constructor - creates builder for the given table |
fromFetchData($data, $table) | Static constructor - creates builder from ReportFetchData |
dimension($dimension) | Sets the dimension to group by |
metrics($metrics) | Sets the metrics array |
addMetric($metric) | Adds a single metric |
orderBy($rule) | Sets the ordering rule |
filters($filters) | Sets dimension filters |
limit($limit) | Sets maximum number of results |
paginate($params) | Sets pagination parameters |
groupInterval($interval) | Sets the grouping interval |
groupByDay() | Groups by day |
groupByWeek() | Groups by week |
groupByMonth() | Groups by month |
groupByQuarter() | Groups by quarter |
groupByYear() | Groups by year |
withoutGrouping() | Disables grouping (full interval) |
dateRange($start, $end, $column) | Sets date range and optional column |
dateColumn($column) | Sets the date column for filtering |
sinceTimestamp($ts, $column) | Sets relative timestamp filtering |
timestampColumn($column) | Sets the timestamp column |
hideEmptyValues($hide) | Hides null dimension values |
totalsOnly($totals) | Returns only totals, not rows |
onConfigureQuery($callback) | Registers query customization callback |
onConfigureMetrics($callback) | Registers metrics configuration callback |
onConfigureMetric($callback) | Registers per-metric configuration callback |
when($condition, $callback) | Conditionally applies configuration |
get($metricsConfig, $urlTemplate) | Executes query and returns results |
toSql() | Returns the SQL string (for debugging) |
# Pre-Aggregated Data
When using ReportQueryBuilder or ReportDataQueryBuilder, data is aggregated at the SQL level using GROUP BY and aggregate functions. The query builders automatically signal this to the framework so that the results are only normalized (gap-filled with missing periods) and not re-aggregated in PHP.
If your data source performs its own aggregation, for example, fetching pre-grouped data from an external API or using custom SQL — you should set the pre-aggregated flag on the result to prevent double aggregation:
protected function fetchData(ReportFetchData $data): ReportFetchDataResult
{
    // Data is already aggregated by the group interval
    $rows = $this->fetchFromExternalApi($data);

    $result = new ReportFetchDataResult($rows);
    $result->setPreAggregated();

    return $result;
}
When setPreAggregated is set, the framework will still normalize the data for date dimensions (filling in missing date periods with null values) but will not re-aggregate metric values. This is important for aggregate functions like COUNT and AVG where re-aggregation would produce incorrect results.
Note: If your data source returns raw daily rows and relies on the framework to aggregate them into weeks, months, etc., do not set this flag. The framework will handle the aggregation automatically.
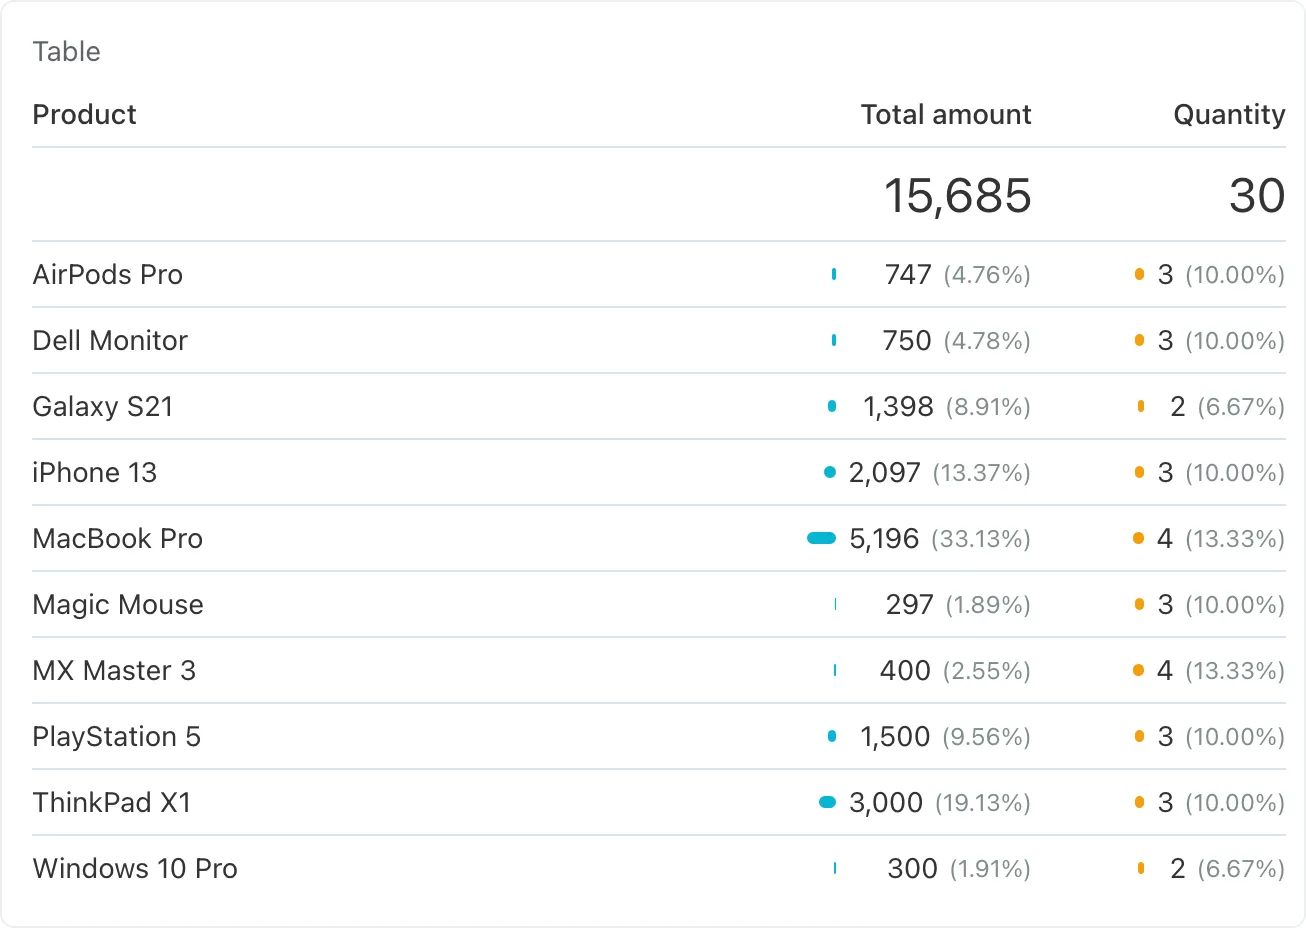
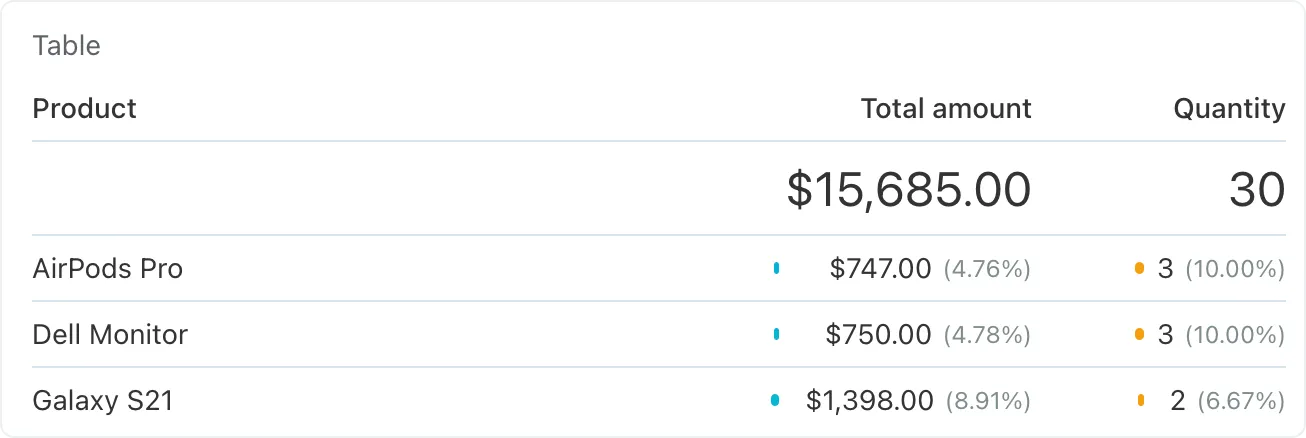
This configuration is sufficient to display the data source data in a table widget:
# Formatting Metrics Data
By default, the dashboard formats metrics data as numbers. If the default formatting is not suitable, you can configure metrics to display data in other formats. In our ecommerce example, it makes sense to display the total amount as currency.
The final parameter of the ReportMetric class constructor takes an array of options that are compatible with the options argument of Intl.NumberFormat (opens new window), a browser API. The example below demonstrates a configuration ideal for displaying currency in the US format:
$this->registerMetric(new ReportMetric(
    self::METRIC_TOTAL_AMOUNT,
    'acme_shop_sales.total',
    'Total amount',
    ReportMetric::AGGREGATE_SUM,
    [
        'style' => 'currency',
        'currency' => 'USD',
    ]
));
The updated metric data is displayed on the dashboard as follows:
# Custom Display Formatting
While Intl.NumberFormat handles most numeric formatting needs (currencies, percentages, compact notation), some metrics require custom string transformations that cannot be achieved with standard number formatting. For example, displaying durations as "2:30h" instead of "150" minutes.
The setDisplayFormatter method allows you to define a server-side callback that formats metric values into human-readable strings. This formatted value is used in non-graph displays such as tables and indicators, while charts continue to use the raw numeric values.
$this->registerMetric(
    (new ReportMetric(
        self::METRIC_DURATION,
        'acme_entries.duration_minutes',
        'Duration',
        ReportMetric::AGGREGATE_SUM
    ))->setDisplayFormatter(function ($value) {
        $totalMinutes = (int) $value;
        $hours = intdiv($totalMinutes, 60);
        $minutes = $totalMinutes % 60;
        return sprintf('%d:%02dh', $hours, $minutes);
    })
);
When a display formatter is set:
- Tables: Cell values and totals display the formatted string (e.g., "2:30h")
- Indicators: The main value displays the formatted string
- Charts: Raw numeric values are used (formatting would break graph rendering)
You can combine setDisplayFormatter with intlFormatOptions. If both are set, the display formatter takes precedence for non-graph displays, while intlFormatOptions serves as a fallback for contexts where server-side formatting isn't available.
$this->registerMetric(
    (new ReportMetric(
        self::METRIC_DURATION,
        'acme_entries.duration_minutes',
        'Duration',
        ReportMetric::AGGREGATE_SUM,
        ['style' => 'unit', 'unit' => 'minute'] // Fallback for charts
    ))->setDisplayFormatter(function ($value) {
        // Used for tables and indicators
        $hours = intdiv((int) $value, 60);
        $minutes = (int) $value % 60;
        return sprintf('%d:%02dh', $hours, $minutes);
    })
);
# Displaying Extra Dimension Data
In our demo database structure, the products table has a brand column. Additionally, it references the categories table, ensuring each product is linked to a category. We can display the brand and category names in reports along with the product name by using the dimension fields feature.
Dimension fields should be added to a dimension within the data source constructor. The dimension object includes the addDimensionField method, accepting a configured dimension field object. Here's how we can add dimension fields for the brand and category names to the product dimension:
$this->registerDimension(new ReportDimension(
    self::DIMENSION_PRODUCT,
    'acme_shop_products.id',
    'Product',
    'product_name'
))->addDimensionField(new ReportDimensionField(
    'oc_field_brand',
    'Brand',
    'brand',
    true,
    true
))->addDimensionField(new ReportDimensionField(
    'oc_field_category',
    'Category',
    'acme_shop_categories.category_name',
    true,
    true
));
The ReportDimensionField constructor takes these arguments:
| Argument | Type | Description |
|---|---|---|
| $code | string | specifies the field referral code. The code must begin with the oc_field_ prefix. |
| $displayName | string | specifies the field name to use in reports. For example, in the Table widget, this could become the title of the dimension column. It is also used in the widget configuration popup, in the dimension dropdown. The value for this argument can be a static string, or a reference to a localization string. |
| $columnName | ?string | optional database column name for filtering or sorting. Provide the column name to enable sorting and filtering. In most cases, you should specify a value for this argument. |
| $sortable | bool | specifies if the field is sortable. |
| $filterable | bool | specifies if the field is filterable. |
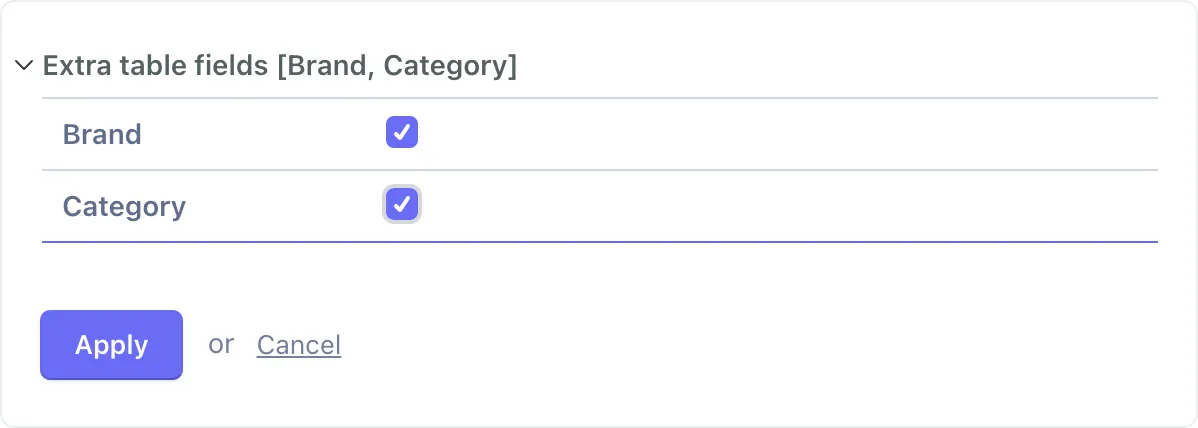
After registration, the dimension field will appear in the dashboard widget configurators:
The remaining task involves returning data for the dimension fields. Since ReportQueryBuilder does not automate this process, it's necessary to configure its underlying query to add a join and add the corresponding columns to the query. This can be accomplished in the onConfigureQuery callback:
ReportQueryBuilder::fromFetchData($data, 'acme_shop_products')
    ->dateColumn('acme_shop_sales.sale_date')
    ->onConfigureMetrics(function($query, $dimension, $metrics) {
        $query->leftJoin('acme_shop_sales', function($join) {
            $join->on('acme_shop_sales.product_id', '=', 'acme_shop_products.id');
        });
    })
    ->onConfigureQuery(function($query, $dimension, $metrics) {
        $query->leftJoin('acme_shop_categories', function($join) {
            $join->on('acme_shop_categories.id', '=', 'acme_shop_products.category_id');
        });

        $query->addSelect([
            Db::raw('max(acme_shop_products.brand) as oc_field_brand'),
            Db::raw('max(acme_shop_categories.category_name) as oc_field_category'),
        ]);
    })
    ->get($data->metricsConfiguration);
It may seem odd that we use the max function for the product brand and category. The reason this is necessary is because the query is grouped by the product ID column (dimension), and we must use aggregation functions on all columns to avoid MySQL errors. This simple trick resolves the issue.
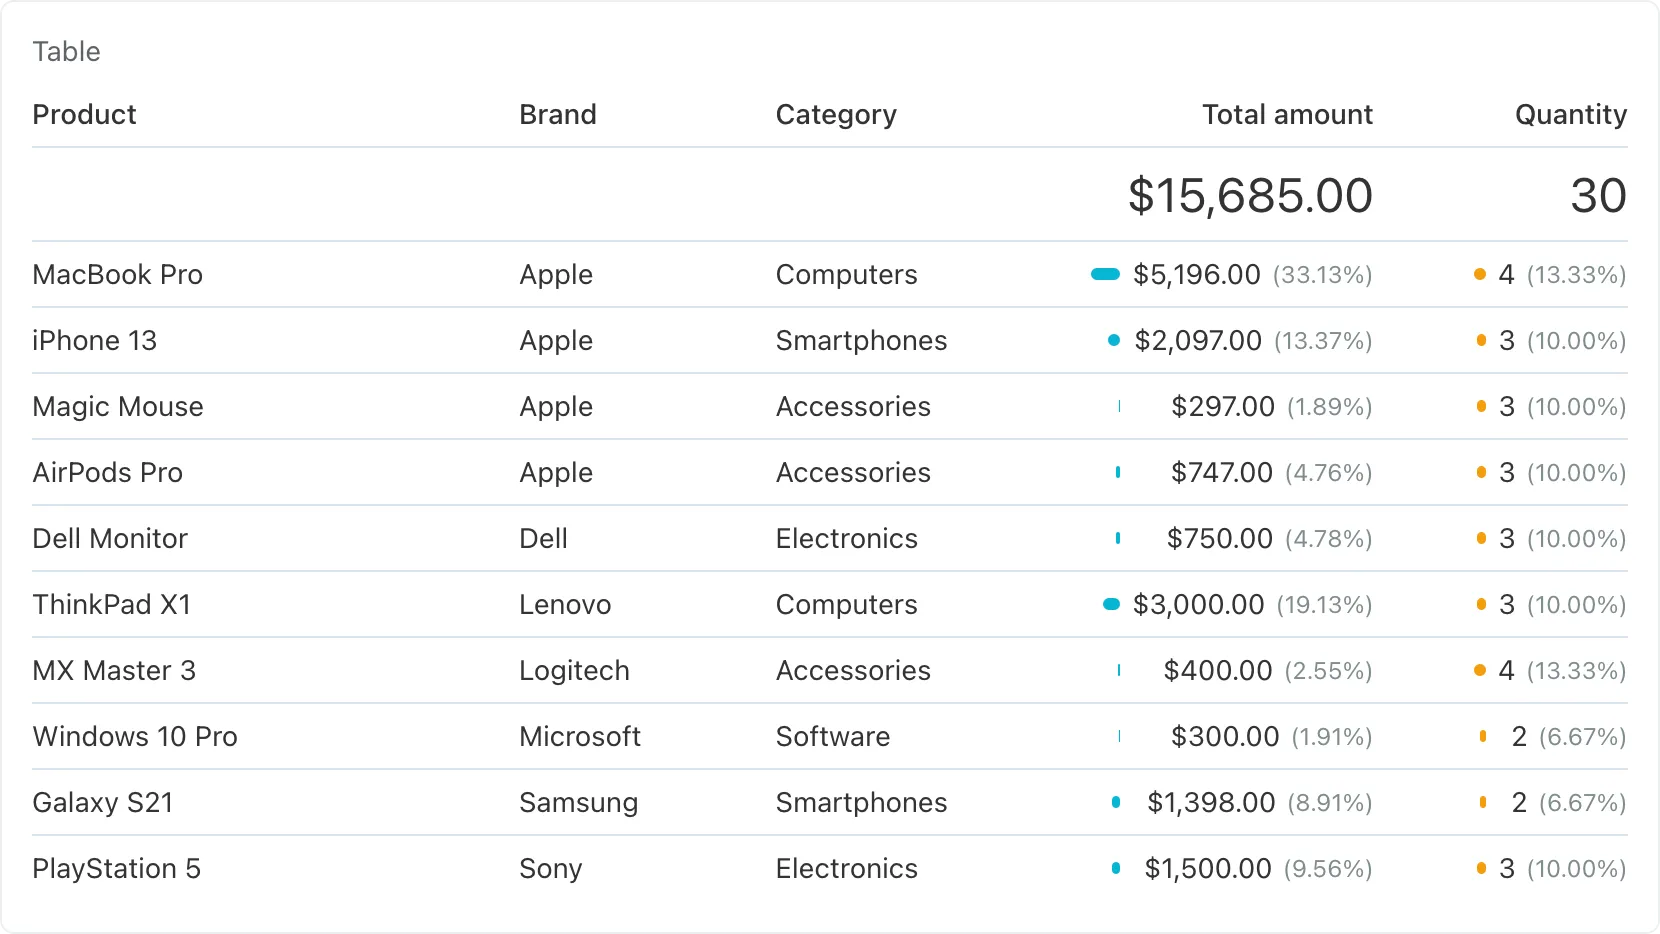
The dimension fields are now available for preview in the dashboard. Users can configure widgets to sort data by the brand or category column:
# Using the Data Source
A properly configured data source is immediately ready for use in all types of dashboard widgets without additional setup. For example, you can configure the Chart widget to display the top products.
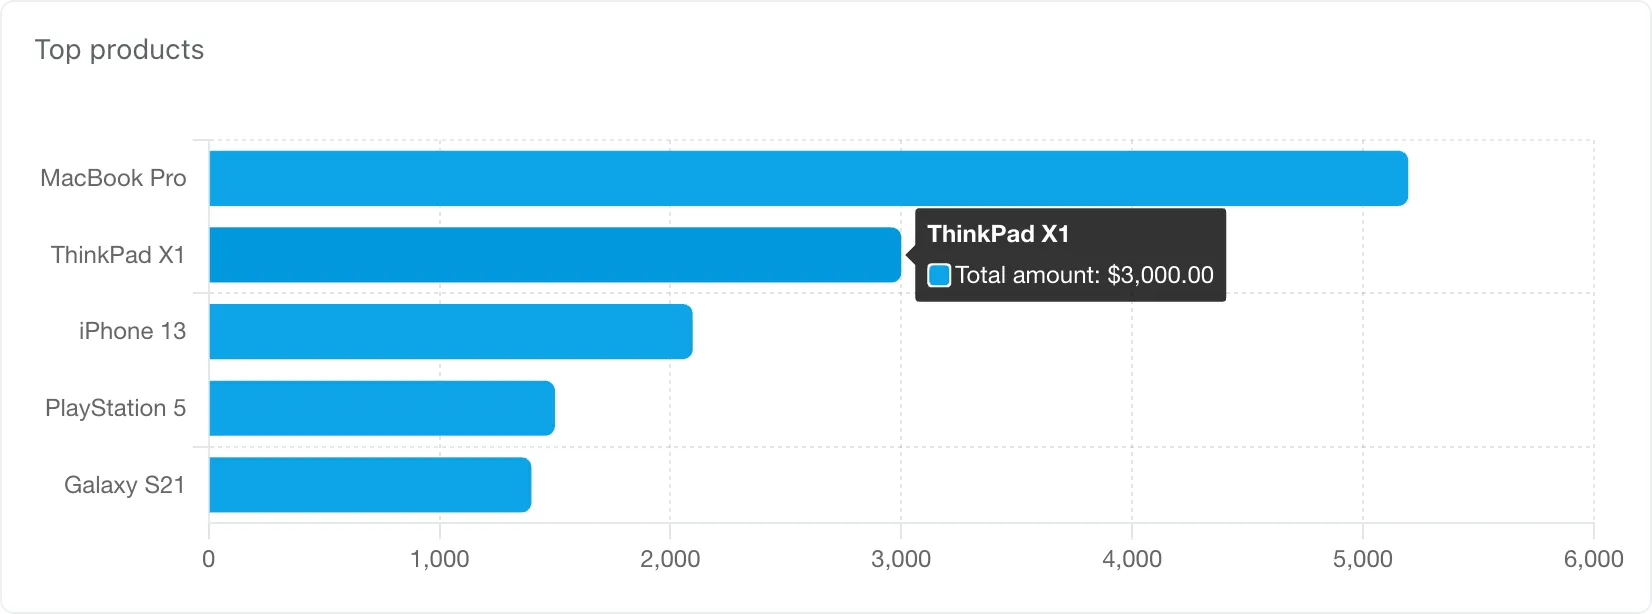
In this example, the chart widget is set up as follows:
- Chart type: Bar
- Direction: Horizontal
- Data source: Our test data source
- Dimension: Product
- Metrics: Total amount
- Limit: 5
- Sort by: Total amount
- Sort order: Descending
- Display: Dashboard interval
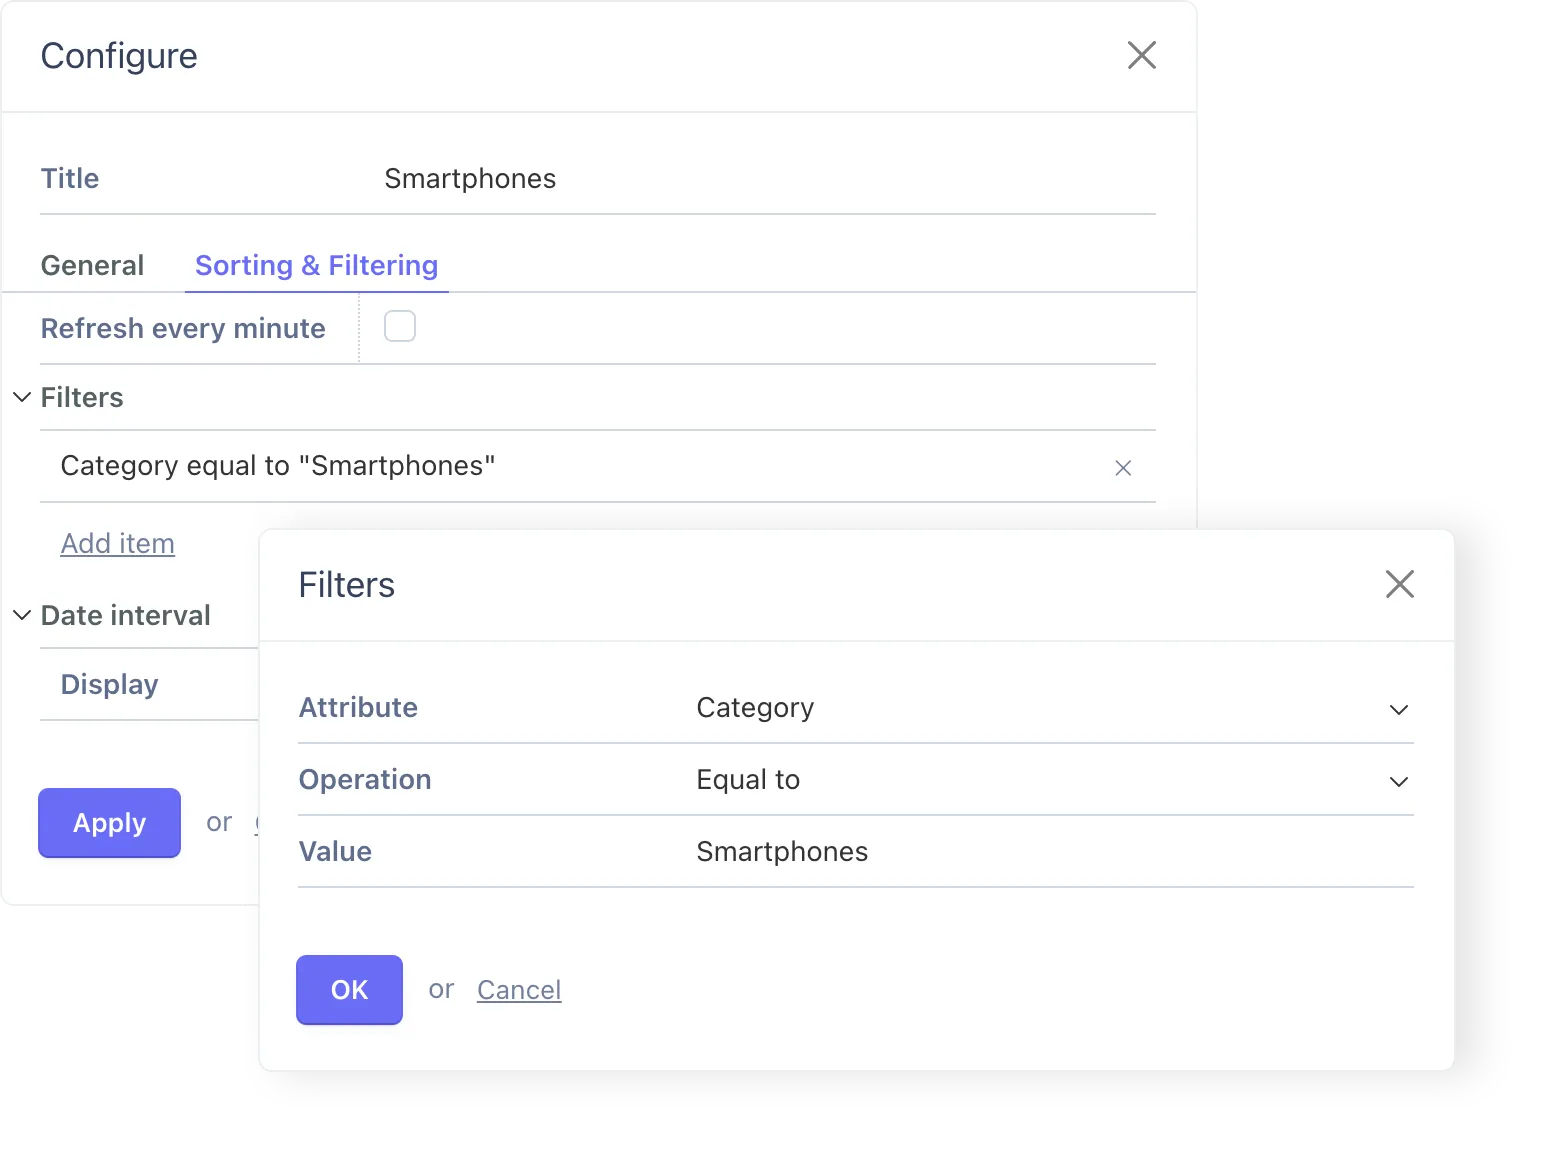
You can also configure the Indicator widget to display totals, with the option to filter the data by a specific brand or category:

In this example, the Smartphones Indicator widget is set up as follows:
- Data source: Our test data source
- Dimension: Product
- Value: Total amount
- Filters attribute: Category
- Filter operation: Equals
- Value: Smartphones
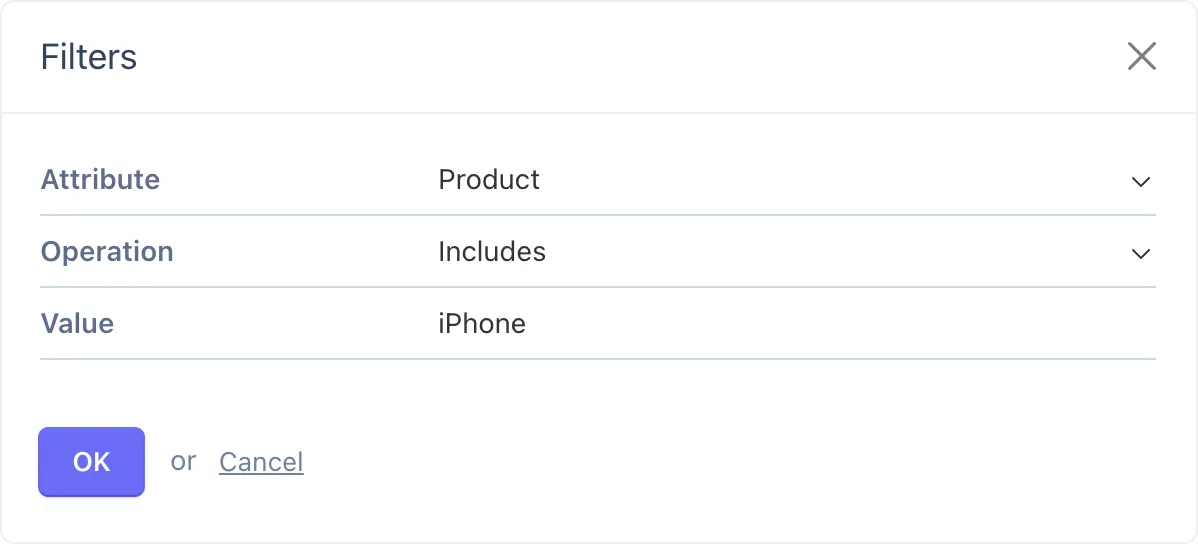
The iPhones Indicator widget uses the following filter configuration:
- Attribute: Product
- Operation: Includes
- Value: iPhone
# Legacy ReportDataQueryBuilder
For backward compatibility, the original ReportDataQueryBuilder class is still available. This class uses a constructor-based approach with 15 parameters:
use Dashboard\Classes\ReportDataQueryBuilder;

$reportQueryBuilder = new ReportDataQueryBuilder(
    'acme_shop_products',      // Table name
    $data->dimension,          // Dimension
    $data->metrics,            // Metrics array
    $data->orderRule,          // Order rule
    $data->dimensionFilters,   // Filters
    $data->limit,              // Limit
    $data->paginationParams,   // Pagination
    $data->groupInterval,      // Group interval
    $data->hideEmptyDimensionValues,  // Hide empty values
    $data->dateStart,          // Date start
    $data->dateEnd,            // Date end
    $data->startTimestamp,     // Start timestamp
    'sale_date',               // Date column
    null,                      // Timestamp column
    $data->totalsOnly          // Totals only
);

$reportQueryBuilder->onConfigureMetrics(function($query, $dimension, $metrics) {
    // Configure metrics...
});

return $reportQueryBuilder->getFetchDataResult($data->metricsConfiguration);
The legacy class also provides a fromFetchData static method as a shorthand:
$reportQueryBuilder = ReportDataQueryBuilder::fromFetchData(
    $data,
    'acme_shop_products',
    'sale_date',  // Date column
    null          // Timestamp column
);
Note: New implementations should use
ReportQueryBuilderfor its cleaner fluent interface and better readability.